
还剩8页未读,
继续阅读
所属成套资源:人教版数学五年级下册教材练习课件
成套系列资料,整套一键下载
人教版五年级下册7 折线统计图精品ppt课件
展开
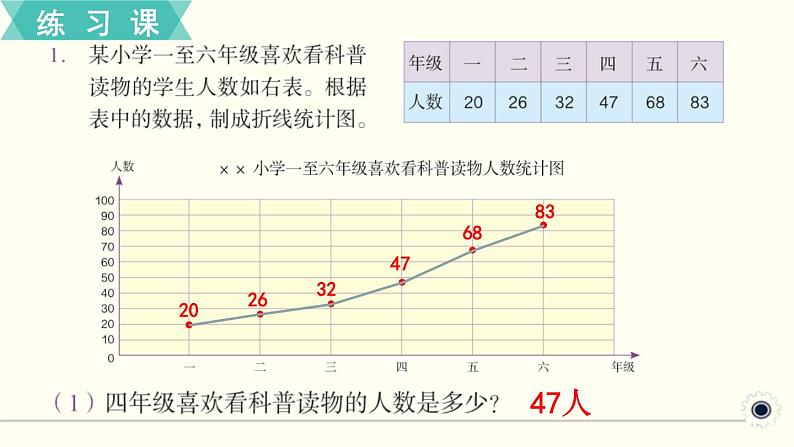
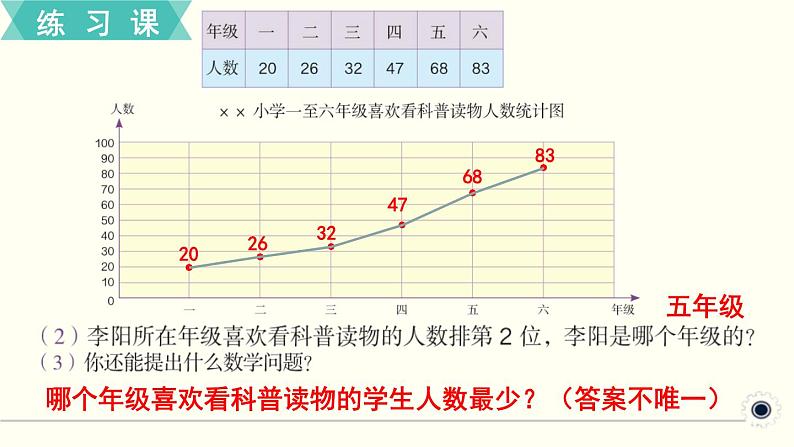
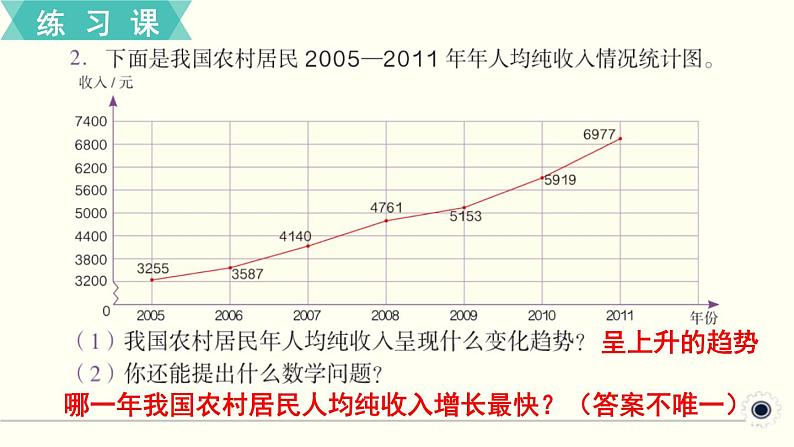
这是一份人教版五年级下册7 折线统计图精品ppt课件,共15页。PPT课件主要包含了五年级,呈上升的趋势等内容,欢迎下载使用。
哪个年级喜欢看科普读物的学生人数最少?(答案不唯一)
哪一年我国农村居民人均纯收入增长最快?(答案不唯一)
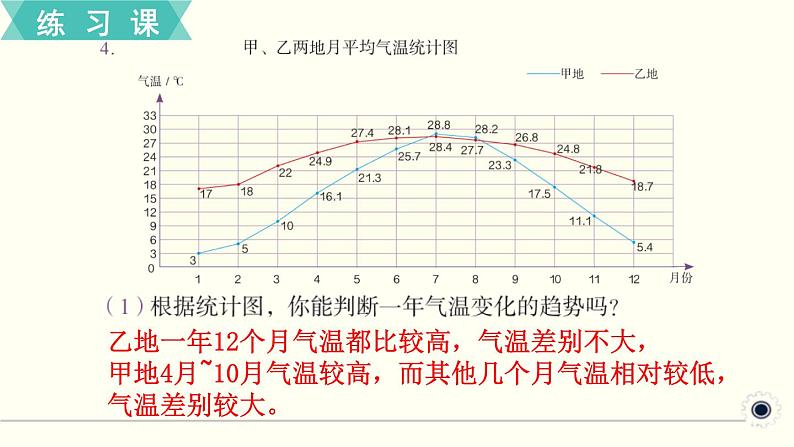
乙地一年12个月气温都比较高,气温差别不大,甲地4月~10月气温较高,而其他几个月气温相对较低,气温差别较大。
乙地10月的平均气温为24.8℃,甲地10月的平均气温为17.5 ℃,应该准备厚一点的衣服。
通过比较发现,该地区7-15岁的男、女生平均身高都在随着年龄的增长而增高,但在13岁之后女生的身高增长速度比男生慢。
第(1)组数据用条形统计图比较合适;第(2)组数据用折线统计图比较合适。
哪个年级喜欢看科普读物的学生人数最少?(答案不唯一)
哪一年我国农村居民人均纯收入增长最快?(答案不唯一)
乙地一年12个月气温都比较高,气温差别不大,甲地4月~10月气温较高,而其他几个月气温相对较低,气温差别较大。
乙地10月的平均气温为24.8℃,甲地10月的平均气温为17.5 ℃,应该准备厚一点的衣服。
通过比较发现,该地区7-15岁的男、女生平均身高都在随着年龄的增长而增高,但在13岁之后女生的身高增长速度比男生慢。
第(1)组数据用条形统计图比较合适;第(2)组数据用折线统计图比较合适。
相关课件
小学数学人教版五年级下册7 折线统计图优秀ppt课件: 这是一份小学数学人教版五年级下册7 折线统计图优秀ppt课件,共30页。PPT课件主要包含了创设情境,探索新知,巩固练习,课堂小结,课后练习等内容,欢迎下载使用。
小学数学人教版五年级下册7 折线统计图说课课件ppt: 这是一份小学数学人教版五年级下册7 折线统计图说课课件ppt,共18页。PPT课件主要包含了更形象,注意别忘了标数据,先描点,再连线等内容,欢迎下载使用。
五年级下册7 折线统计图备课课件ppt: 这是一份五年级下册7 折线统计图备课课件ppt,共17页。PPT课件主要包含了制作成统计图,写出统计图标题,画出横轴与纵轴,描点连线等内容,欢迎下载使用。